



 +31 20 820 3777
 Support
  Documentation
 Login
Login 




Author: Senior Devops. Hostkey Lead Infrastructure Specialist Nikita Zubarev
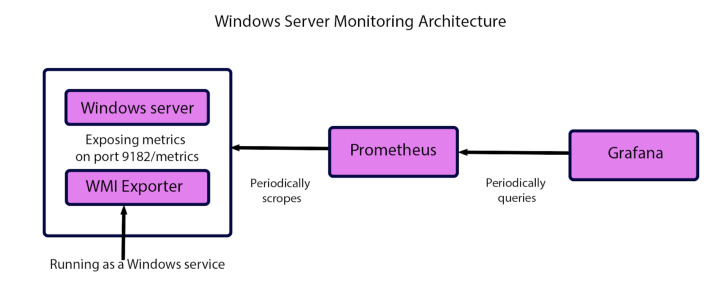
Earlier we talked about how Linux systems are monitored. Now let's look at how to set up Windows Server.
In one of the previous articles, we discussed integrating FreeIPA with Active Directory. In the process of developing the solution described in that article, we needed to note the metrics from the servers using Windows infrastructure. In this article, we will look at how you can set up monitoring for Windows servers using an existing system built on a combination of Prometheus + Grafana + Alertmanager. We will collect general system metrics: cpu, ram, hdd.
The WMI exporter can also be used to monitor IIS sites and applications, network interfaces, services, and even local temperature.
Detailed information about the WMI exporter can be found on GitHub.
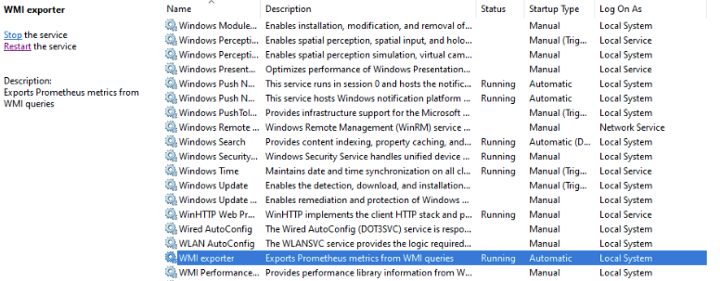
After installing the necessary exporter, go to the "Windows Services" panel (just type "Services" in the Windows search menu) and find the WMI exporter in the list. Next, you need to check that the service is working correctly.
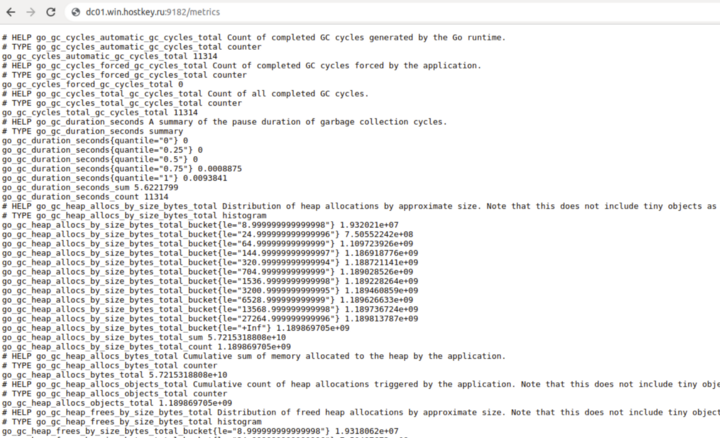
If the exporter is running, it should start providing metrics at http://localhost:9182/metrics, similar to the Node Exporter. All you need to do is activate the collection of metrics in Prometheus, add a dashboard and set up your alerts:
Add to prometheus.yml:
  - job_name: 'Windows_Infra'
	static_configs:
		- targets: ['”localhost”:9182']
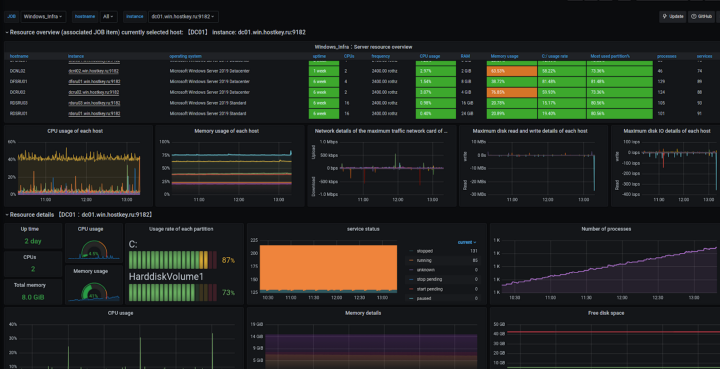
Add a Grafana dashboard. It monitors the display of the dashboard, connects and optimizes the output of a detailed summary of resources. It provides a visual panel for each host:
What you have to do now is describe the rule_files by adding the necessary metrics:
 groups:
	- name: Windows_Infra
		rules:
		- alert: InstanceDown
			expr: up{job="Windows_Infra"} == 0
			for: 5m
			labels:
				severity: page
			annotations:
				summary: "Instance {{ .instance }} down"
				description: "{{ .instance }} of job {{ .job }} has been down for more than 5 minutes."

		- alert: DiskSpaceUsage
			expr: 100.0 - 100 * (windows_logical_disk_free_bytes{job="Windows_Infra"} / windows_logical_disk_size_bytes{job="Windows_Infra"}) > 90
			for: 10m
			labels:
				severity: high
			annotations:
				summary: "Disk Space Usage (instance {{ $labels.instance }})"
				description: "Disk Space on Drive is used more than 90%\n  VALUE = {{ $value }}\n  LABELS: {{ $labels }}"
Add any other necessary parameters in the same way. When Alertmanager is configured, notifications will automatically be sent to connected systems.
As you can see, monitoring Windows servers can be done easily with Prometheus and Grafana. This solution greatly simplifies the process of managing a large fleet of machines and allows you to quickly solve problems that arise when administering server equipment with our company. In the following articles, we will consider the task of connecting Windows services.